- Fourier transform infrared spectroscopy -
By means of the interaction of infrared radiation with the sample, the method provides information on its molecular composition.
dating
morphology
technology
origin
composition
alteration

Ceramic

Metal

Mortar

Pigments

Stone

Wood
Ceramic Building Materials (CBM)
Certain compounds* in ceramics and glass can function as a “chemical signature” and can thus indirectly indicate the geographical provenance of their raw materials by comparing their FTIR spectra with the ones of materials of known origin.The chemical composition of glass can also provide evidence of the historical period it was produced.
Furthermore, it is possible to detect degradation/corrosion products (e.g.efflorescence salts) and to observe their stratigraphy, as well as to detect previous restoration areas (e.g. identifying restoration adhesives) (Stuart, 2007).
Metals & Alloys
For patina analysis of metals and alloys: identification of their corrosion products, stratigraphy, as well as chemical mapping.
Additionally, FTIR mapping is used in the evaluation of protective coatings and corrosion inhibitors on metals (Mazzeo & Joseph, 2004).
Pigments
Frequently used for analysis of painted materials, such as murals, mosaic tesserae, frescoes, stained glass. It is possible to distinguish pigments of the same tonality and original painted layers from later additions, as well as to identify the binders used (Mazzeo et al.,2006).
Also used to characterize alteration products of pigments.
Stone, Mortar & Plaster
Commonly used to characterize natural minerals in stone materials and mortars (Genestar & Pons, 2003; Genestar et al., 2005). By means of FTIR spectroscopy it is possible to detect and monitor surface deposits and degradation products of stone, mortars and plaster, like black crusts; their chemical composition can reveal the source of degradation (air pollution or previous treatments) (Galletti et al., 1996).
FTIR can also reveal previously consolidated areas (e.g. identifi cation of polymers),the depth of penetration of protective coatings on stone materials (Casadio & Toniolo, 2004)
Can be a useful tool for evaluating restoration treatments, e.g.laser cleaning, by comparing the FTIR spectra of the treated and the untreated
surface (Stuart, 2007).
Wood
FTIR is often used to monitor the degradation of wood, by analysing both the structure of wood components and the chemical changes occurring in them either due to environmental factors or due to diff erent treatments (Colom et al., 2003).
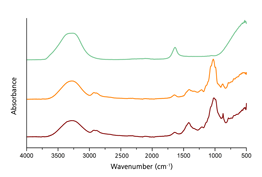
FTIR spectrum. Image by Nora Pérez Castellanos
Infrared spectroscopy is a micro-destructive technique that uses infrared (IR) light to investigate the molecular composition of materials. FTIR spectroscopy is frequently used for the characterization of cultural heritage materials, because of its capability to identify both organic and inorganic chemical compounds even in very small samples of complex composition and because of its applicability on any type of material. Furthermore, the technique allows collecting a large number of FTIR spectra on surfaces in order to create chemical compound distribution maps (chemical mapping*).
accuracy
time
cost
in situ
invasive
destructive
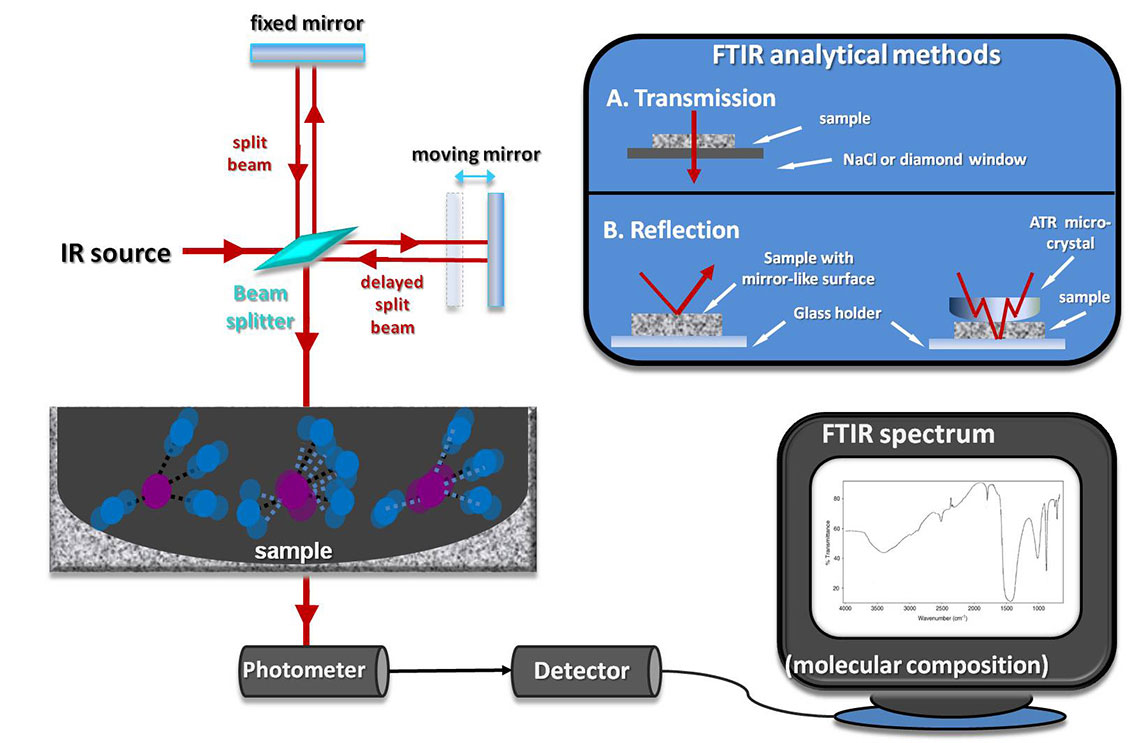
FTIR spectroscopy measures the residual IR radiation emitted by the sample after an IR beam has been transmitted through or refl ected off it. The diff erence between the incident and the emitted energies is relative to the absorption capacity of the molecules the sample is composed of. It produces two spectra (IR & Background) which are merged and a final FTIR spectrum, containing strictly the peaks due to the sample, is obtained. In order to interpret a FTIR spectrum it is either compared to known spectra found in spectral libraries or each peak is attributed separately.