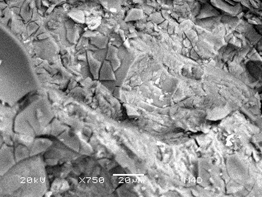
High-resolution image of the morphology of a sample's top surface
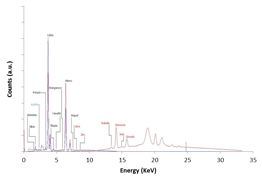
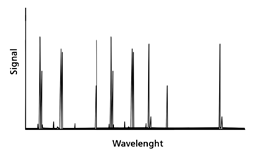
XRF
Spectrum: x-axis shows elements (identified by the wavelengths of the emitted X-rays) and y-axis shows elements relative concentration ratios.
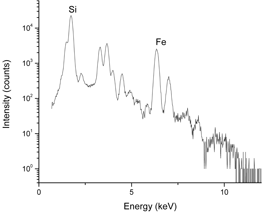
PIXE
Spectrum: x-axis shows elements (identified by emitted X-ray wavelengths) and y-axis shows concentration ratios..
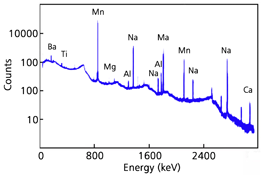
NAA
Spectrum: x-axis shows elements (identified by emitted characteristic gamma-rays) and y-axis shows element concentration ratios.
ICPAS
Spectrum: x-axis shows elements (identified by the wavelengths of the emitted photons) and y-axis shows the relative element concentrations.
Compound Analysis
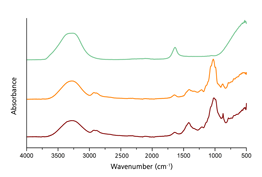
FTIR
Spectrum: x-axis shows compounds (identified by the characteristic difference in wavenumber between the incident beam and the scattered light) and y-axis shows the intensity.
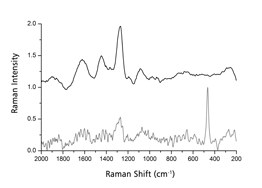
Raman
Spectrum: x-axis shows compounds (identified by the characteristic difference in wavenumber between the incident beam and the scattered light) and y-axis shows the intensity.
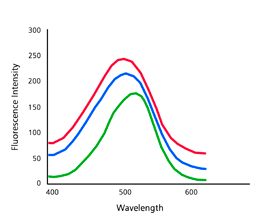
UV Fluorescence
Spectrum: x-axis shows compounds (identified by the characteristic wavelength or wavenumber of the emitted light) and y-axis shows the fluorescence intensity.
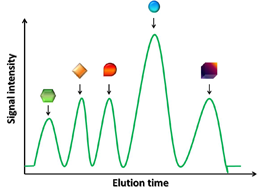
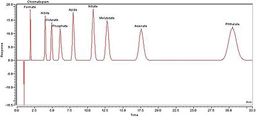
Chromatograpy
Chromatogram: x-axis shows compounds (identified by the characteristic time of elution) and y-axis shows the quantity of each component present in the sample.
Thermal Analysis
TGA
X-axis shows the temperature increasing on a constant heating rate in controlled atmosphere and y-axis shows the weight variations occurring in the sample.
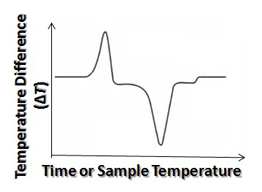
DTA
X-axis shows time or temperature at which a sample suffers specific transformations (such us crystallization, fusion or melting) and y-axis shows temperature variations of a the sample and a reference material equally heated.
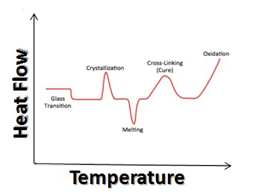
DSC
X-axis shows the temperature at which a sample suffers specific transformations (such as crystallization, fusion or melting) and y-axis shows the amount of energy heat flow needed.
DTA
X-axis shows time or temperature at which a sample suffers specific transformations (such us crystallization, fusion or melting) and y-axis shows temperature variations of a the sample and a reference material equally heated.
ION Analysis
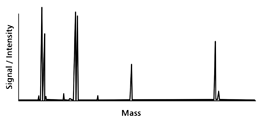
ICP-MS
Spectrum: x-axis shows elements (identified by the characteristic ions microorganism) and y-axis shows their concentration.
Ion Chromatography
Chromatogram: x-axis shows ions(identified by the characteristic time of elution) and y-axis shows the quantity of each component present in the sample.
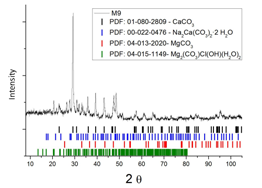
Chrystaline Analysis
XRD
Spectrum: x-axis shows crystalline material (identified by the characteristic diffraction angle) and y-axis shows their relative concentration.
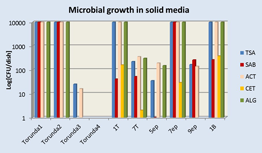
Biological Analysis
Biological Cultures
Graphic: x-axis shows the microorganism and y-axis shows the number of viable bacteria or fungal cells contained by sample.
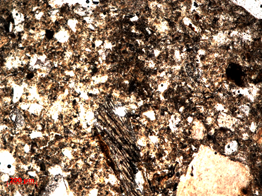
Micromorphology Analysis
OM
Image: Magnified image of the sample.
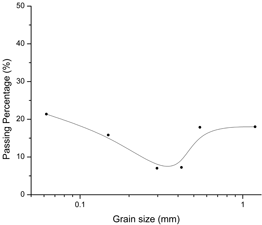
Granulometry
Graph: Granulometric curve x-axis shows the grain sizes and y-axis shows the weight percentage.
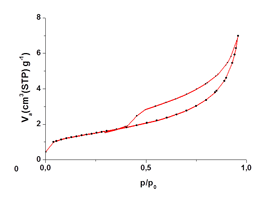
Porosimetry
Graph: x-axis shows the pore diameter and y-axis shows the total volume of each pore type.
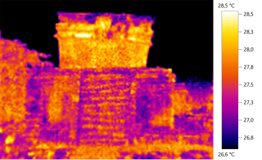
Thermal Analysis
IR Thermography
Colour Image: Areas with the highest temperature detected are shown in white colour, intermediate temperatures correspond to red and yellow parts of the image, and the coolest parts go from purple to blue.
Structural Integrity
EC
Colour Image: Areas with the highest temperature detected are shown in white colour, intermediate temperatures correspond to red and yellow parts of the image, and the coolest parts go from purple to blue.
Dating
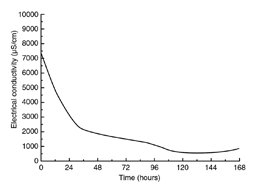
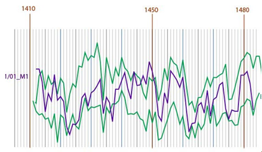
Dendrochronology
Graph: x-axis shows the time and y-axis shows the material's ability to conduct an electric current
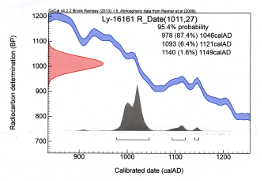
C14 Dating
Graph: x-axis shows the probability distribution of the radiocarbon age, i.e. number of years counting from 1950 back and y-axis shows the probability in our calendar age. The blue line is the calibration line which allows the translation from radiocarbon age into calendar years
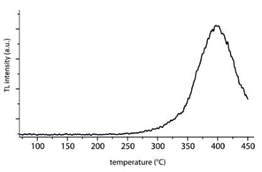
TL
Graph: x-axis shows the temperature at which the material is stimulated and y-axis shows the intensity of the luminescence (emission of photons)
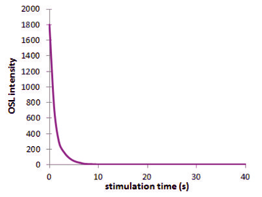
OSL
Graph: x-axis shows the stimulation time of exposure and y-axis shows the intensity of the luminescence (emission of photons).
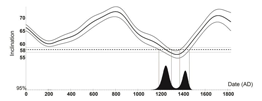
Archaeomagnetism
Graph: x-axis shows the possible years and y-axis shows the inclination plot (thermoremanent magnetization). The curve is the known reference inclination curve along the time